Google
Click-here for a FREE copy of Emotional Free Trading E-book Increase your sales by 100% GUARANTEED! CLICK HERE

Friday, December 29, 2006

Insider Trading


ASIA – Holdings, Inc

Holdings, Inc. and its subsidiaries provide telecom software solutions and information technology (IT) security products and services to the telecommunications market in China. Its products and services enable its customers to build, maintain, operate, manage, and develop communications infrastructure. The company operates in two divisions, Technologies and Lenovo- . Technologies division provides business support systems/operating support systems, including billing, customer relationship management, intercarrier network access payment management, and operating analysis and decision support systems and solutions; and network infrastructure solutions consisting of network access and backbone infrastructure planning, design, and implementation for telecommunications and Internet service providers. It also offers service application solutions, including messaging software to support electronic mail systems, antispam software, antivirus solution for scanning and clearing viruses before emails are downloaded, and a support platform for value-added short messaging services, as well as a network hard disk product that facilitates Internet-based file transfer, sharing, and management. Lenovo- division principally provides IT security products and services for small to medium size companies with a focus on the firewall and virtual private network sectors. This division also offers financial services IT solutions, including bank core business processing systems, bank business performance management systems, bank call center systems, and bank notification systems. Holdings was founded in 1993 and is based in Beijing.

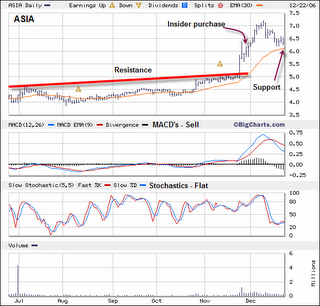
Towards the end of November two insiders made some rather large purchases of ASIA stock. Directors James Ding and Edward Tian together bought 2.45 million shares at a total cost off $14.61 dollars. On the same day of the purchase, “On November 29, 2006, Holdings, Inc. (the "Company") entered into a Strategic Investors' Agreement (the "Agreement") with CITIC Capital MB Investment Limited, an exempted company organized and existing under the laws of the Cayman Islands ("CITIC Capital") and PacificInfo Limited, an international company organized and existing under the laws of the British Virgin Islands ("PacificInfo"). PacificInfo is wholly-owned by Mr. Edward Tian, a founder and stockholder of the Company and a member of its board of directors.”

The stock has been in a consolidation mode for most of the year as it continued to bump its head up against overhead resistance at the up sloping red trendline. Then just days before the large insider purchase he stock exploded upward to new highs. On December 11th, the stock hit a 52-week high of $7.21. Once the new high was established the stock then retraced back to support at its 30-dma. The stock trades in the technology/computer networks industry which is trading at new yearly high prices. Currently, the MACD’s are revealing a sell signal while the Stochastics have rotated flat.

Friday, December 22, 2006

A Position Trader-A real trade


Let’s take a look at an example of how this strategy works. The chart above is a five-minute chart of Mastercard [MA].

It looks like we have all four guidelines present for the mid-day setup. During this time the stock was trading higher than the previous day’s closing price, and it was also trading above its opening price. During the mid-day time period the stock was tending sideways at or near the day’s high and it had been doing so for more than 1 ½ hours. Now that we have the first four guidelines setup this stock goes on our list and we wait for the late-day time period to begin at or around 2:15 p.m.

Around 2:15 p.m. as soon as our stock breakouts of its sideways channel we place a buy order. We buy the stock when it trades one tick above the sideway intraday high prices. A tick is simply a price unit that the stock trades in. For example, if you were to look at a NASDAQ Level II screen and you saw that the inside ask or best asking price that you could buy the stock was $94.00 and the next higher price above that was $94.02.

We also have all three guidelines present for the late-day breakout. During the mid-day time period as the stock was consolidating it reached a high of $94.60, so once the late-day time period begins and the stock trades above this price by one tick or 0.02 cents (the stock trades in 0.02 cent increments) then you would enter the trade. A stop-loss could be placed just below the low price of the mid-day sideways price base which reached a low of $93.95. Lastly, we’ll exit the trade once prices pull back. This will be a judgment call as to how much you are willing to let prices pullback before you exit the trade. The main thing to remember is to never let a wining trade turn into a losing trade. Meaning if you had entered this trade and were profitable right from the start as the stock rallied higher and you noted a pullback, don’t wait too long to exit the trade that all the earlier profits are given back as the stock retraces. Exiting at breakeven is much better than exiting at a loss.

Thursday, December 21, 2006

Bear Call Spread

OSIP(OSI Pharmaceuticals, Inc)
Sell Jan 40.00 call$0.60
Buy Jan 45.00 call$0.20
Net credit $0.40

Return 8.70%

OSI Pharmaceuticals, Inc. engages in the discovery, development, and commercialization of pharmaceutical products for the treatment of oncology, ophthalmology, and diabetic diseases in the United States.

Technicals: The stock had a solid rally higher from the months of May to October which resulted in a 52-week high of $43.17. After the new high, prices slipped below the support area of the 30-dma finally finding support near the $36 mark. Prices are now coiling between overhead resistance at the down sloping trendline and support below near $36. The stock trades in the health care/biotechnology & drugs industry which looks to be bumping up against resistance and rolling over. There doesn’t appear to be much institutional interest as the stock’s fundamentals are very weak. Both the MACD’s and the Stochastics are flashing sell signals. There is a possibility of a bounce off support but there isn’t anything at this time that would cause the stock to rally through overhead resistance.

A Position Trader

A trading strategies for swing and position traders is a technique for those traders who have the time to watch the market throughout the day and have access to inter day charts. Trading inter day requires a high degree of skill and the ability to emotionally detach from the markets.

Typically the middle of a trading day falls within the time periods of 11:15 a.m. and ends somewhere around 2:15 p.m. EST. It is during this time period that someone who watches the market all day long will note that things really begin to slow down often becoming very choppy in nature not really trending in one direction or another. For that reason, this is frequently one On the other hand, during the time period of 2:15 p.m. to 4:00 p.m. EST things begin to stop churning and start trending. This is the time period that we will be looking to actually place our trade. After a morning rally in the markets, the mid-day doldrums soon follow as the markets begin to consolidate. It is during this time that the setup for our trade begins to take shape. However, once mid-day has passed we’ll be looking to take advantage of the price action that occurs between 2:15 p.m. to 4:00 p.m. EST.of the hardest times to trade during the day.

On the other hand, during the time period of 2:15 p.m. to 4:00 p.m. EST things begin to stop churning and start trending. This is the time period that we will be looking to actually place our trade. After a morning rally in the markets, the mid-day doldrums soon follow as the markets begin to consolidate. It is during this time that the setup for our trade begins to take shape. However, once mid-day has passed we’ll be looking to take advantage of the price action that occurs between 2:15 p.m. to 4:00 p.m. EST.

This strategy is by using a five minutes inter day charts. Here are the guidelines that we’ll use for the trade setup:The stock needs to be trading higher than the previous day’s close. The stock should be trading at or above its opening price. During the mid-day time period the stock should be trending sideways at or near the day’s high price. On a five-minute chart, the sideways trend should be at least 1 ½ hours in length.

During the mid-day time period the trader will stop trading and go searching for stocks that meet the above criteria, and make a list of these stocks. Once the list is in place the trader waits for the time period from 2:15 p.m. to 4:00 p.m. EST to commence.

Below are the guidelines used to trade the late-day breakout: Again using a five-minute chart, the trader will initiate a trade once prices move one tick above the side way inter day high prices. Once the trade has been initiated the trader will place a stop-loss just below the mid-day side way price base. The trader will then exit once prices begin to reverse direction or exit at the end of the day with a Market On Close order.

We will exit the trade once prices pull back. This will be a judgment call as to how much you are willing to let prices pullback before you exit the trade. The main thing to remember is to never let a wining trade turn into a losing trade. Meaning if you had entered this trade and were profitable right from the start as the stock rallied higher and you noted a pullback, don’t wait too long to exit the trade that all the earlier profits are given back as the stock retraces. Exiting at break-even is much better than exiting at a loss.

if you’re lucky enough and the stock should continue to run higher for the rest of the day without significantly pull back in price, then you can exit at the close of the day (and hopefully the high of the day) with a Market On Close order.

This trading strategy is not for all, but it can be used successfully by those who have the time to watch the markets throughout the day.

Monday, December 18, 2006

Investment Banker

Last week Goldman Sachs (GS) reported record earnings that were up 93% from the previous year. The news media really picked up on the fact that this translated into some incredible bonuses for the employees, including the amazing fact that the average bonus would be around $600,000. As a major player on Wall Street, this good earnings news probably helped the DOW to close at record levels for the week. Goldman Sachs main business is what is known as ‘Investment Banking’. But this is not banking as most people look at it. Just exactly what is investment banking?

Investment bankers are not really bankers at all. The fact that the word banker appears in the name is partially responsible for the false impression that they are like most banks. Investment bankers are not permitted to accept deposits from anyone. They do not provide checking accounts or savings accounts for customers. An investment banker is simply a securities firm that specializes in helping other business firms (generally corporations) obtain the money they need on the best terms possible.

When it comes to the actual process of having stock or bonds issued, corporations approach an investment banking firm and will ask it to act as advisor and distributor. When the investment banking firm assists a corporation in the distribution of stocks or bonds, they are acting as an underwriter. So the investment banker is the middle man in the market between corporations and investors.

The investment bankers, like a stock brokerage firms, receive their money through fees and the ‘spread’ between the public price stocks are being offered at and the price that the firm buys the stock at. These fees are normally set before an offering. There are also usually commission fees that go out to brokers that are designed in such a way that the brokers are encouraged to sell new stock offerings to their clients.

Bottom Line – In general, when the investment banking firms are doing well, the stock market will usually be on the bullish side of things, as we are seeing now with the Goldman Sachs earnings. When corporations are optimistic about the future, they tend to go to the public markets more for additional capital for expansion. So, these earning numbers from Goldman’s are another reinforcement of the healthy nature of the current market.

Saturday, December 16, 2006

Bear Call Spread for week & next

Done a bear call spread on TELK

Selling Jan07 @ 25 for 1.80
Buy Jan07 @ 30 for 1.15
Net credit is 0.75 for Jan07 expiry date.

Next week will be watching earning play for ORCL & FDS

Friday, December 08, 2006

Bear Call Spread for Jan 07

I have entered a Bear Call spread for ticker symbol ONXX for the expiry month of January 07
Sell Jan 22.50 call at $1.05
Buy Jan 25.00 call at $0.35
Net credit $0.70

Net return for the month -16.28%

ONXX-Onyx Pharmaceuticals, Inc. operates as a biopharmaceutical company in the United States.

Technicals: From the beginning of the year, the stock began to breakdown; this resulted in a multi-month decline to lower prices and a 52-week low of $12.70. After the new low prices did manage to break back above the 30-dma trending all the way back up to close a gap that occurred during the month of June. Now, that the gap has been closed the stock has reversed direction falling below the support area of the 30-dma and the rising trendline. The stock trades in the health care/biotechnology & drugs industry which has been trending sideways over the last two months and there hasn’t been any institutional interest in a long while. Both the MACD’s and the Stochastics are signaling selling pressure.

The business of trading

Investing in the stock market is often exciting and at times can be very rewarding. The rewards are easy to explain because you want rewards, the more the better. However, when it comes to losing money , it is an entirely different feelings.

Trading is always associated with different level of risks and we often need to find the level of risk we are able to tolerate and comfortable with.

One of the biggest mistakes is that if we try to invest our money that we cannot afford to lose and we need this money for our basic living like buying groceries or paying our utilities bill , then that is not investing, that like gambling in Las Vegas.

The stock market has been proven to be a fantastic place to invest and grow our money over long period of time and accordingly to finding, it is one of the best asset that outperform other class of assets over a 20 years time span. However, investing in hopes of making a fortune overnight usually involves tremendous amount of risk and never be done except with "risk capital" which mean money you can afford to lose without changing your present lifestyle and financial circumstances if it is lost.

Investor often has to battle the emotion of fear and greed in the stock market and therefore we if we are not able know what has gone wrong and have the discipline to put a stop lost and a trading plan to exit because of greed , then our career in the stock market is often said to be short-lived. The discipline investors are said to be very mechanical and automatic. They have a trading plan and they stick to it as they know that not every investment is a winner.
As said earlier, the biggest enemy of an investor is emotion, when stocks are dropping and investment starts to lose money , you may get into "house of pain"and with this feeling, it is difficult to make good decision thereafter, worst of all, you find it hard to sleep.

In conclusion, managing the risk before going into a trade and stick closely to our pre-determined trading plan of entry and exit points will help us to take the emotion out of investing.

Stock valuations for the year ending 2006

We often hear things in the stock market like (P/E) ratio. So what does this indication really mean. In general this means using measurements to determine if stocks are valued higher or lower that the historical mean.

The year of 2006 is almost coming to an end and the DOW is at historical high at 12,000 levelThe price to earnings (P/E) ratio has outpaced the rise in the S&P 500 index during the past two years. In the third quarter of 2004, the S&P 500 P/E ratio was 20.3, in the third quarter of 2005 it was 18.4, and the just completed third quarter of 2006 has a P/E ratio of 17.5. If you look at operating earnings the numbers are even better, with a current operating P/E ratio of 16.0.

Therefore the decline in the P/E ratio is a bullish factor. As long as this type of earnings growth continues to outpace the market, the rally will continue. Athough the current P/E ratios are slightly above historical averages, but nevertheless represent very good value given current economic conditions.

A standard starting point used in the market for valuation is to compare the P/E ratio based on expected future year earnings to the yield on the 10-year Treasury bond. On this basis alone, stocks could be considered significantly undervalued. The P/E ratio for the next twelve months based on just 5% growth in operating earnings is 15.3. That is equivalent to a 6.6% earnings yield (this is earnings divided by price). That compares extremely favorably to a current 4.7% yield on the U.S. Treasury 10-year bond. By this measurement stocks could be currently undervalued by over 40%.So the overall market is fairly bullish, and as long as inflation is kept in check that the market could continue to rally . Of course there are always the unknown factors, including world events such as terrorist and oil factor which can always change things quickly. But for now, these factors are aligned in a bullish way.